What is standard deviation and why it matters
Princeton Journal of Pre-Collegiate Research
What is Standard Deviation and Why It Matters: A Complete Guide
Understanding what is standard deviation and why it matters is one of the most valuable skills you can develop when working with data. Whether you are a student, a business analyst, a scientist, or simply someone who wants to make better decisions, standard deviation is a concept that appears everywhere — from weather forecasts to investment portfolios to quality control in manufacturing. In this comprehensive guide, we will break down this essential statistical measure in plain language, walk through real-world examples, and show you exactly why it deserves a place in your analytical toolkit.
What is Standard Deviation and Why It Matters in Statistics
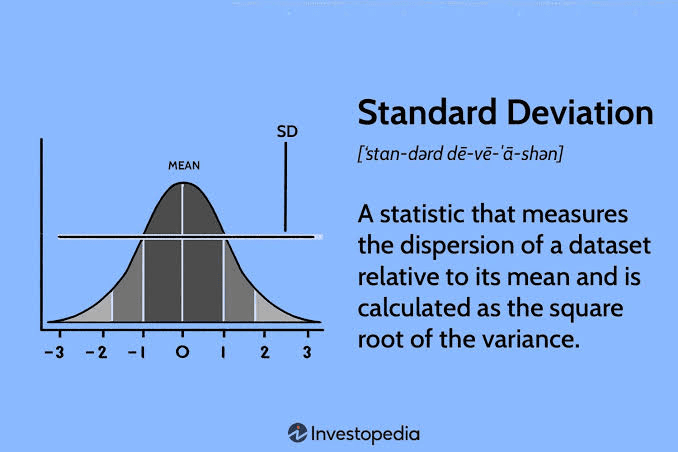
Standard deviation is a measure of how spread out the values in a data set are relative to the mean, or average. In simple terms, it tells you how much the individual data points differ from the average value. A low standard deviation means the data points are clustered closely around the mean, while a high standard deviation means the data points are spread out over a wider range.
The concept was formalized in the late 19th century by statistician Karl Pearson, and it has since become one of the most widely used tools in statistics. It is represented by the Greek letter sigma (σ) for a population and the letter s for a sample.
To calculate standard deviation, you follow these steps:
Find the mean of your data set.
Subtract the mean from each data point and square the result.
Find the average of those squared differences (this is called the variance).
Take the square root of the variance.
The result is the standard deviation — a single number that summarizes the variability of your entire data set.
A Simple Example to Build Intuition
Imagine two teachers give their students a test scored out of 100. In Teacher A's class, the scores are: 78, 79, 80, 81, 82. In Teacher B's class, the scores are: 50, 65, 80, 95, 100. Both classes have the same average score of 80, but the experiences are very different.
Teacher A's class has a standard deviation of about 1.4 points. Teacher B's class has a standard deviation of about 19.6 points. The average alone tells you nothing about how varied the performance was. Standard deviation fills in that crucial gap.
This example illustrates why relying solely on averages can be misleading. Two situations can look identical on the surface but be fundamentally different in their variability — and that variability often matters enormously.
What is Standard Deviation and Why It Matters in Finance and Investing
One of the most prominent real-world applications of standard deviation is in finance. Investors and financial analysts use it as a primary measure of risk. When evaluating an investment, the expected return (the average) is important, but so is the volatility — and that is where standard deviation comes in.
Consider two investment funds, both with an average annual return of 8 percent. Fund A has a standard deviation of 2 percent, meaning its returns typically fall between 6 and 10 percent. Fund B has a standard deviation of 15 percent, meaning its returns could swing dramatically from -7 percent to 23 percent or beyond in any given year.
For a conservative investor nearing retirement, Fund A is far more appropriate. For a younger investor with a long time horizon and higher risk tolerance, Fund B might be acceptable. Without understanding standard deviation, both funds look identical based on average returns alone.
This principle extends to stock market analysis, options pricing, portfolio diversification, and risk management. The famous Black-Scholes model for pricing options relies heavily on the standard deviation of asset returns. Modern portfolio theory, developed by Harry Markowitz, uses standard deviation as its core measure of risk.
Applications in Science and Research
In scientific research, standard deviation is indispensable. When researchers conduct experiments, they rarely measure a single outcome. Instead, they collect multiple measurements and report the mean along with the standard deviation to communicate both the central tendency and the variability of their results.
For example, a pharmaceutical company testing a new drug might find that it reduces blood pressure by an average of 10 mmHg. But if the standard deviation is 1 mmHg, the drug is highly consistent. If the standard deviation is 8 mmHg, the drug works dramatically for some patients and barely at all for others — a critical distinction for doctors and patients.
In physics, chemistry, and engineering, measurements always come with some degree of uncertainty. Standard deviation quantifies that uncertainty, allowing scientists to determine whether differences between experimental groups are statistically significant or simply due to random variation.
Quality Control and Manufacturing
Manufacturing industries rely heavily on standard deviation through a methodology called Statistical Process Control (SPC). When producing thousands or millions of identical parts, manufacturers need to ensure consistency. A part that is too large or too small can cause failures in the final product.
By monitoring the standard deviation of measurements taken from the production line, quality engineers can detect when a process is drifting out of control — often before defective products are even produced. The famous Six Sigma methodology, adopted by companies like Motorola and General Electric, is literally named after the goal of achieving a process where defects occur no more than 3.4 times per million opportunities, which corresponds to six standard deviations from the mean.
This approach has saved corporations billions of dollars and is a testament to how a single statistical concept can have massive practical consequences.
Standard Deviation in Everyday Life
You do not need to work in finance or science to benefit from understanding standard deviation. It shows up in everyday contexts more than most people realize.
When you see a weather forecast that says the high temperature will be 75 degrees Fahrenheit, that is an average prediction. The actual temperature could vary. Meteorologists use standard deviation to communicate the uncertainty in their forecasts and to model climate patterns over time.
In education, standardized tests like the SAT and ACT are designed with specific means and standard deviations in mind. A score that is one standard deviation above the mean places a student in approximately the top 16 percent of test-takers. Understanding this helps students, parents, and educators interpret scores meaningfully.
In healthcare, growth charts for children are based on population means and standard deviations. When a pediatrician says a child is in the 85th percentile for height, that assessment is grounded in standard deviation calculations applied to large population data sets.
The Empirical Rule: Making Standard Deviation Practical
One of the most useful tools for applying standard deviation is the empirical rule, also known as the 68-95-99.7 rule. For data that follows a normal distribution (the classic bell curve), this rule states:
Approximately 68 percent of data points fall within one standard deviation of the mean.
Approximately 95 percent of data points fall within two standard deviations of the mean.
Approximately 99.7 percent of data points fall within three standard deviations of the mean.
This rule gives you an immediate, intuitive sense of what any standard deviation value means in practice. If you know that adult male heights in a given population have a mean of 70 inches and a standard deviation of 3 inches, you instantly know that about 95 percent of men are between 64 and 76 inches tall.
The empirical rule is why standard deviation is so powerful — it transforms an abstract number into a concrete statement about probability and expectation.
Common Misconceptions About Standard Deviation
Despite its widespread use, standard deviation is frequently misunderstood. Here are a few common misconceptions worth addressing.
Misconception 1: A higher standard deviation is always bad. This is not true. In some contexts, variability is desirable. A creative brainstorming session that produces wildly different ideas has high variability — and that is the point. Context determines whether high or low standard deviation is preferable.
Misconception 2: Standard deviation and variance are the same thing. Variance is the square of the standard deviation. While they measure the same underlying concept, standard deviation is expressed in the same units as the original data, making it far more interpretable. If you are measuring heights in inches, the standard deviation is also in inches, while the variance would be in square inches — a less intuitive unit.
Misconception 3: Standard deviation only applies to large data sets. While it is more reliable with larger samples, standard deviation can be calculated for any data set with at least two values. However, with very small samples, you should use the sample standard deviation formula (dividing by n-1 rather than n) to avoid underestimating the true population variability.
How to Use Standard Deviation in Your Own Analysis
If you want to start applying standard deviation in your own work or life, here are some practical steps to get started.
First, identify what you are measuring and collect your data points. This could be monthly sales figures, daily step counts, test scores, or any other numerical series. Second, calculate the mean of your data. Third, use a spreadsheet tool like Microsoft Excel or Google Sheets, which have built-in functions (STDEV for samples, STDEVP for populations) to calculate standard deviation instantly. Fourth, interpret the result in context. Ask yourself: is this level of variability acceptable? Is it higher or lower than expected? What might be causing it?
By making standard deviation a regular part of how you examine data, you will develop a much richer and more accurate understanding of the world around you.
Conclusion
Understanding what is standard deviation and why it matters opens up a new dimension of analytical thinking. It moves you beyond surface-level averages and into a deeper understanding of variability, risk, consistency, and uncertainty. From investment decisions to scientific research, from manufacturing quality to everyday statistics, standard deviation is one of the most versatile and powerful tools in the world of data. The next time you encounter an average, ask yourself: what is the standard deviation? That question alone will make you a sharper, more informed thinker.
Read More

How to write a grant proposal as a student
By
Princeton Journal of Pre-Collegiate Research
Read more

Free resources that replace research funding
By
Princeton Journal of Pre-Collegiate Research
Read more

Corporate and nonprofit programs that fund student research
By
Princeton Journal of Pre-Collegiate Research
Read more

Science fair grants and material stipends explained
By
Princeton Journal of Pre-Collegiate Research
Read more

Crowdfunding a student research project: does it work
By
Princeton Journal of Pre-Collegiate Research
Read more

How much does a research project actually cost
By
Princeton Journal of Pre-Collegiate Research
Read more

How to ask your school to fund your project
By
Princeton Journal of Pre-Collegiate Research
Read more

Grants for high school research projects: what exists
By
Princeton Journal of Pre-Collegiate Research
Read more

How to start a research club at your school
By
Princeton Journal of Pre-Collegiate Research
Read more

How to organize a school research symposium
By
Princeton Journal of Pre-Collegiate Research
Read more

Turning a school club into a research pipeline
By
Princeton Journal of Pre-Collegiate Research
Read more

How to start a student research journal at your school
By
Princeton Journal of Pre-Collegiate Research
Read more

How to find a faculty sponsor for a research club
By
Princeton Journal of Pre-Collegiate Research
Read more

How to propose an independent study for research credit
By
Princeton Journal of Pre-Collegiate Research
Read more

Running a peer-review workshop at your school
By
Princeton Journal of Pre-Collegiate Research
Read more

How to get school funding for student research
By
Princeton Journal of Pre-Collegiate Research
Read more

How to do research as a team of students
By
Princeton Journal of Pre-Collegiate Research
Read more

Dividing work fairly in a group research project
By
Princeton Journal of Pre-Collegiate Research
Read more

Group research vs solo research: pros and cons
By
Princeton Journal of Pre-Collegiate Research
Read more

Resolving disagreements in group research
By
Princeton Journal of Pre-Collegiate Research
Read more

What to do when a co-author stops contributing
By
Princeton Journal of Pre-Collegiate Research
Read more