What is regression analysis and when do you use it
Princeton Journal of Pre-Collegiate Research

What is regression analysis and when do you use it
Regression analysis is one of the most widely used statistical methods in published research, yet many high school students either skip it entirely or apply it incorrectly. This post explains what regression analysis is, when it is the appropriate method to use, and how to apply it correctly in an original research project. It is written for students in grades 9 through 12 who are conducting quantitative research and need to understand this method before writing their results section. Students whose work is ready for peer review can submit original research to the Princeton Journal of Pre-Collegiate Research.
What is regression analysis and when do you use it?
Regression analysis is a statistical method that estimates the relationship between one outcome variable and one or more predictor variables. It tells you how much the outcome changes when a predictor changes, while holding other variables constant. Researchers use it when they want to quantify a relationship, test whether a predictor is statistically significant, or control for confounding variables in observational data.
To understand regression, it helps to start with what it actually produces. A regression model generates a mathematical equation. In its simplest form, that equation is a straight line: Y = a + bX. Y is the outcome you are trying to explain, X is the predictor variable, b is the slope (how much Y changes for each one-unit increase in X), and a is the intercept (the value of Y when X equals zero).
This is called simple linear regression. When a study includes more than one predictor variable, the method is called multiple linear regression. The logic is the same, but the equation includes a separate coefficient for each predictor. Multiple regression is particularly useful in social science and economics research, where outcomes rarely have a single cause.
Regression is appropriate under specific conditions. The outcome variable must be continuous and measured on a numerical scale. The relationship between the predictor and the outcome should be approximately linear, which you can check by plotting the data on a scatter plot before running the analysis. The data points should be independent of each other, meaning one observation should not influence another. Residuals, which are the differences between predicted and actual values, should be approximately normally distributed.
When these conditions are met, regression is one of the most informative tools available to a student researcher. It does not just confirm that two variables are related; it tells you the direction of the relationship, the size of the effect, and whether that effect is likely to be real or the result of random variation. A published paper in PJPCR's quantitative social sciences section, examining minimum wage increases and employment in the U.S. restaurant sector, used a synthetic control analysis that shares the same underlying logic as regression: isolating the effect of one variable while accounting for others.
Students working with ecological or climate data can find a comparable example in PJPCR's published research on Arctic sea ice extent decline and albedo feedback amplification, which relies on time-series data analysis with multiple interacting variables, a context where regression is frequently the method of choice.
What happens after you run a regression, and how do you interpret the output?
Running a regression in software like R or Python takes seconds. Interpreting the output correctly takes considerably more care, and this is where most student papers fall short.
A regression output table typically includes several columns. The coefficient column shows the estimated slope for each predictor: how much the outcome variable changes for a one-unit increase in that predictor. The standard error column measures the uncertainty around that estimate. The t-statistic is the coefficient divided by the standard error. The p-value tells you the probability of observing that t-statistic if the true coefficient were zero.
A p-value below 0.05 is conventionally treated as statistically significant, meaning the result is unlikely to be due to chance alone. However, statistical significance is not the same as practical significance. A regression coefficient can be statistically significant and still represent a trivially small real-world effect. Students should always report the coefficient size alongside the p-value and discuss what the magnitude means in context.
The R-squared value is another key output. It tells you what proportion of the variation in the outcome variable is explained by the predictors in the model. An R-squared of 0.65 means the model accounts for 65 percent of the variation in the outcome. A high R-squared is not always the goal; in social science research, models with R-squared values of 0.20 to 0.40 are often considered informative, because human behavior is influenced by many factors no single study can fully capture.
Students who want a practical guide to running regression in a free, widely used environment can consult the PJPCR blog post on how to use R for high school research data analysis, which covers setup, syntax, and output interpretation at a beginner level.
What are the most common mistakes students make when using regression analysis?
The most frequent errors in student regression papers are not computational. They are conceptual, and they lead to conclusions that peer reviewers cannot accept regardless of how clean the data are.
The first and most serious mistake is treating regression output as proof of causation. Regression estimates associations. It does not establish that one variable causes another. A regression showing that students who sleep more score higher on standardized tests does not prove that sleep causes higher scores; a third variable, such as overall health or study habits, could explain both. Students should describe their findings in terms of association or prediction, not causation, unless the study design specifically supports a causal claim.
The second common mistake is omitting important control variables. When a relevant predictor is left out of the model, its effect gets absorbed by the variables that are included, distorting every coefficient in the table. This is called omitted variable bias. Before running a regression, students should list every variable they believe influences the outcome and make a deliberate decision about which ones to include, with a written justification for each exclusion.
The third mistake is running regression on data that violate its assumptions without checking. Regression requires a roughly linear relationship between predictors and the outcome. If the true relationship is curved, a linear regression will produce misleading coefficients. A simple scatter plot before analysis catches this problem in most cases. The American Statistical Association's 2016 statement on p-values, published in The American Statistician, explicitly warns against using statistical significance as a binary pass-fail threshold, a warning directly relevant to how students report regression results.
The fourth mistake is confusing correlation with regression. Correlation measures the strength and direction of a linear relationship between two variables. Regression estimates the equation of that relationship and allows for multiple predictors. They are related but not interchangeable. A student who reports a correlation coefficient when the research question requires a regression model has answered a different question than the one posed.
How to use regression analysis in a high school research paper, step by step
State a specific research question that involves predicting or explaining a continuous outcome variable using one or more measurable predictors.
Collect or obtain a dataset with sufficient observations. As a general guideline, a simple linear regression requires at least 20 to 30 data points; multiple regression requires more, with a common rule of thumb being at least 10 observations per predictor variable.
Plot your data. Create a scatter plot of the outcome variable against each predictor. Confirm that the relationship appears approximately linear before proceeding.
Check for outliers. Extreme values can distort regression coefficients substantially. Identify any outliers, investigate whether they represent data entry errors or genuine observations, and document your decision.
Run the regression using statistical software. R, Python, and SPSS are all appropriate for student research. Record the full output table, including coefficients, standard errors, p-values, and R-squared.
Interpret each coefficient in plain language. State the direction and size of each effect and whether it is statistically significant. Do not describe any result as proving causation.
Discuss the limitations of the model, including variables that were not measured and assumptions that could not be fully verified.
Submit the completed paper, including the methods section describing your regression approach, to the submission guidelines page at princeton-jpcr.org/submit to begin the peer review process.
Students using Python for their analysis can find practical guidance in the PJPCR blog post on how to use Python for research data analysis, which covers regression implementation using standard libraries.
PJPCR publishes original quantitative research across all academic disciplines. If your paper uses regression analysis and is ready for peer review, review the submission guidelines at princeton-jpcr.org/submit.
Frequently asked questions about regression analysis
What is regression analysis in simple terms?
Regression analysis is a statistical method that measures the relationship between one outcome variable and one or more predictor variables. It produces a mathematical equation that estimates how much the outcome changes when a predictor changes. Researchers use it to quantify effects, test hypotheses, and control for variables that might otherwise distort the results.
The method is applicable across disciplines, from economics and psychology to biology and environmental science. It is particularly useful when a study involves observational data and the researcher wants to isolate the contribution of a specific variable to an outcome.
How many data points do you need to run a regression analysis?
Simple linear regression with one predictor variable generally requires a minimum of 20 to 30 observations to produce reliable estimates. Multiple regression with several predictors requires more data; a widely used guideline is at least 10 observations per predictor variable included in the model. Smaller samples produce unstable coefficients and inflated standard errors.
Students working with small datasets should consider whether their sample is large enough to support the analysis before committing to regression as their primary method. Reviewers will assess this directly. The standard peer review timeline at PJPCR is 2 to 3 months; a fast-track option is available for students who need a quicker turnaround.
Do I need to know advanced mathematics to use regression analysis in my research?
No. Modern statistical software handles all the calculations. What a student needs is a conceptual understanding of what regression measures, what the output means, and what assumptions the method requires. Software such as R and Python can run a regression with a single line of code once the data are properly formatted.
The more important skill is interpreting the output correctly and writing about it accurately. A student who understands coefficients, p-values, and R-squared, and who knows the difference between association and causation, is equipped to use regression in a publishable paper.
What makes a regression analysis section publishable in a student research paper?
A publishable regression section does four things: it states which variables were included and why, it verifies that the data meet the assumptions of the method, it reports the full output including coefficients and confidence intervals rather than only p-values, and it interprets results in terms of association rather than causation unless the study design justifies a stronger claim.
Reviewers at peer-reviewed journals consistently flag results sections that report only significant findings, omit assumption checks, or overstate what the analysis shows. Transparency about limitations strengthens a paper; it does not weaken it. Browse published issues at princeton-jpcr.org/issues to see how quantitative methods are reported in accepted student papers.
What kinds of research does PJPCR publish that use regression analysis?
PJPCR publishes original quantitative research across the social sciences, natural sciences, economics, psychology, and interdisciplinary fields, all of which commonly use regression as a primary or supporting method. Accepted papers have examined topics ranging from economic policy to ecological data, using regression and related techniques to test specific hypotheses with original datasets.
Submission and peer review are free. A publication fee applies for accepted papers. Students can review the full peer review process at princeton-jpcr.org/peer-review before submitting.
Conclusion
Regression analysis is a precise and widely applicable method for quantitative research. It measures the relationship between an outcome variable and one or more predictors, produces interpretable coefficients, and allows researchers to control for confounding variables in observational data. Using it correctly requires checking assumptions before running the model, reporting the full output rather than selected results, and describing findings in terms of association rather than causation.
Students who apply these principles produce results sections that hold up to critical review. Those whose quantitative research is complete and ready for evaluation can submit original work to the Princeton Journal of Pre-Collegiate Research. If your research is ready for peer review, submit it at princeton-jpcr.org/submit.
Read More

How to write a grant proposal as a student
By
Princeton Journal of Pre-Collegiate Research
Read more

Free resources that replace research funding
By
Princeton Journal of Pre-Collegiate Research
Read more
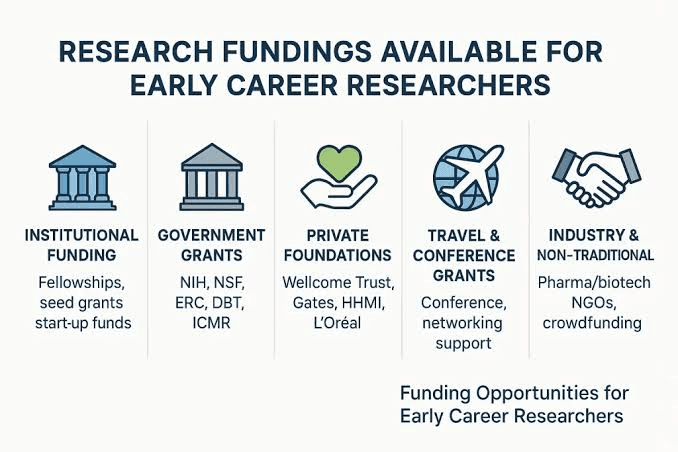
Corporate and nonprofit programs that fund student research
By
Princeton Journal of Pre-Collegiate Research
Read more

Science fair grants and material stipends explained
By
Princeton Journal of Pre-Collegiate Research
Read more

Crowdfunding a student research project: does it work
By
Princeton Journal of Pre-Collegiate Research
Read more

How much does a research project actually cost
By
Princeton Journal of Pre-Collegiate Research
Read more

How to ask your school to fund your project
By
Princeton Journal of Pre-Collegiate Research
Read more

Grants for high school research projects: what exists
By
Princeton Journal of Pre-Collegiate Research
Read more

How to start a research club at your school
By
Princeton Journal of Pre-Collegiate Research
Read more

How to organize a school research symposium
By
Princeton Journal of Pre-Collegiate Research
Read more

Turning a school club into a research pipeline
By
Princeton Journal of Pre-Collegiate Research
Read more

How to start a student research journal at your school
By
Princeton Journal of Pre-Collegiate Research
Read more

How to find a faculty sponsor for a research club
By
Princeton Journal of Pre-Collegiate Research
Read more

How to propose an independent study for research credit
By
Princeton Journal of Pre-Collegiate Research
Read more

Running a peer-review workshop at your school
By
Princeton Journal of Pre-Collegiate Research
Read more

How to get school funding for student research
By
Princeton Journal of Pre-Collegiate Research
Read more

How to do research as a team of students
By
Princeton Journal of Pre-Collegiate Research
Read more

Dividing work fairly in a group research project
By
Princeton Journal of Pre-Collegiate Research
Read more

Group research vs solo research: pros and cons
By
Princeton Journal of Pre-Collegiate Research
Read more

Resolving disagreements in group research
By
Princeton Journal of Pre-Collegiate Research
Read more
What to do when a co-author stops contributing
By
Princeton Journal of Pre-Collegiate Research
Read more