How to use figures and tables effectively in a research paper
Princeton Journal of Pre-Collegiate Research

A poorly labeled figure can undo months of careful research. Learning how to use figures and tables effectively in a research paper is not a stylistic preference; it is a core competency that reviewers, editors, and readers evaluate directly. This guide gives you the framework to get it right.
Why Figures and Tables Matter More Than You Think
Data does not speak for itself. Readers need visual anchors to process complex information quickly. Figures and tables serve that function. They compress large datasets, highlight trends, and make comparisons legible at a glance.
In peer-reviewed publishing, visuals are scrutinized as rigorously as prose. A reviewer who spots an unlabeled axis or a table with inconsistent units will question the reliability of everything else in your paper. That is not an overstatement. Presentation signals competence.
High school researchers often underestimate this. They focus on writing the methods and results sections, then treat figures as an afterthought. That is a mistake. Your visuals are part of your argument. Build them with the same intentionality you bring to your thesis statement.
Figures vs. Tables: Knowing Which to Use
The first decision is choosing the right format for your data. Figures and tables serve different purposes, and using one when the other is appropriate signals a lack of disciplinary fluency.
When to Use a Table
Use a table when your reader needs to look up or compare specific values. Tables work best for precise numerical data, categorical comparisons, and multi-variable summaries. If a reader needs to extract an exact number, a table gives them that without visual interpretation.
Comparison of experimental conditions with multiple measured variables
Summary statistics (mean, standard deviation, sample size) across groups
Categorical data with multiple attributes per category
Demographic breakdowns in social science research
Tables are not just for numbers. In qualitative research, tables can organize themes, codes, or illustrative quotes side by side. The key criterion is whether the reader needs to read across rows and columns to understand the relationship.
When to Use a Figure
Use a figure when the pattern, trend, or relationship is the point. Figures include graphs, charts, photographs, diagrams, maps, and illustrations. They communicate shape and direction faster than any table can.
Line graphs for showing change over time
Bar charts for comparing quantities across categories
Scatter plots for showing correlations between two variables
Diagrams for explaining mechanisms or processes
Maps for geographic distribution data
If your central finding is that one group scored significantly higher than another over six months, a line graph makes that argument instantly. A table would make the reader do the interpretive work themselves. Do not make readers work harder than necessary.
How to Use Figures and Tables Effectively in a Research Paper: Core Rules
These rules apply across disciplines, from biology to economics to political science. Master them before you submit anywhere.
Rule 1: Every Visual Must Be Referenced in the Text
Never insert a figure or table without directing the reader to it explicitly. Write "(see Figure 2)" or "Table 1 shows" before or immediately after the relevant claim. A visual that floats in your paper without a textual anchor confuses readers and suggests poor organization.
The reference should appear in the paragraph where the data is discussed, not three paragraphs later. Proximity matters. Readers should not have to hunt for the connection between your argument and your evidence.
Rule 2: Number Figures and Tables Separately and Sequentially
Figures and tables use independent numbering sequences. Your paper might have Figure 1, Figure 2, Figure 3, and Table 1, Table 2. They do not share a sequence. Number them in the order they appear in the text, not the order you created them.
This convention exists in every major style guide (APA, MLA, Chicago, ACS, APA 7th edition). Check the submission guidelines for the journal you are targeting and follow their specific format exactly.
Rule 3: Write Captions That Stand Alone
A caption is not a title. It is a complete description. A reader who sees only your figure and its caption should understand what the visual shows without reading the surrounding text. This is the standalone test, and it is the standard used in academic publishing.
For figures, place the caption below the image. For tables, place the title above the table. Captions should include what the visual shows, the units of measurement, any abbreviations used, and the source if the data is not original. Keep captions concise but complete.
A weak caption: "Figure 1. Results."
A strong caption: "Figure 1. Mean reaction time (ms) across three age groups (n = 45 per group) under low-stress and high-stress conditions. Error bars represent one standard deviation."
Rule 4: Label Every Axis, Column, and Row
Unlabeled axes are one of the most common reasons figures get flagged during peer review. Every axis on a graph needs a label that includes the variable name and the unit of measurement. Every column and row header in a table needs a clear, unambiguous label.
Do not use abbreviations without defining them in the caption or in a table note. Reviewers should not need to cross-reference your methods section to decode a figure. Clarity is a form of respect for your reader's time.
Rule 5: Do Not Repeat Data in Both a Figure and a Table
Presenting the same data twice in different formats is redundant and wastes space. Choose the format that best serves the data and the argument. If a figure shows the trend and a table shows the exact values, that can be justified. But if both show the same information, cut one.
Space in a research paper is not decorative. Every element should earn its place. Redundant visuals signal that the author has not thought critically about what each element contributes.
Rule 6: Keep Visuals Simple and Purposeful
Complexity in a figure is almost never a virtue. Three-dimensional bar charts, excessive gridlines, and decorative color gradients add visual noise without adding information. Use clean, minimal design. High contrast. Readable font sizes. Consistent formatting across all figures in the paper.
Color should be used functionally, not decoratively. If you use color to distinguish groups, make sure your paper is also interpretable in grayscale (many journals print in black and white). Use different line styles or patterns as a backup.
Discipline-Specific Considerations
Different fields have different conventions. Understanding those conventions signals that you have read the literature in your area and know how research is communicated within it.
In the natural sciences, figures often carry more weight than text. A biology or chemistry paper may present its core findings almost entirely through figures. If you are working in these fields, your figures need to be publication-quality from the start. For guidance on structuring science papers at the high school level, our guides on how to write a biology research paper for high school and chemistry research paper topics for high school students walk through field-specific expectations in detail.
In social sciences and economics, tables often dominate. Regression output tables, demographic summaries, and cross-tabulations are standard. Readers in these fields are trained to read tables fluently. For more on this, see our resource on high school economics research paper ideas and examples.
In humanities fields like history and philosophy, figures are less common but not absent. Maps, timelines, and archival images can strengthen an argument when used purposefully. Our guides on writing a history research paper in high school and how to write a philosophy research paper as a teenager address the specific conventions of those disciplines.
Common Mistakes That Undermine Strong Research
Even well-designed visuals can fail if placed or framed incorrectly. These are the errors that appear most frequently in student submissions.
Placing Visuals Before They Are Referenced
A figure or table should appear after its first mention in the text, not before. Readers encounter your argument first, then see the evidence. Reversing that order disrupts comprehension and suggests the author does not understand narrative flow in academic writing.
Using a Visual Without Interpreting It
Inserting a figure and then moving on without explaining what it shows is a serious omission. You must tell the reader what to take away from each visual. Do not assume the pattern is obvious. State it explicitly: "Figure 3 shows a strong positive correlation between variable A and variable B (r = 0.87, p < 0.01), suggesting..."
Inconsistent Formatting Across Visuals
All figures in a paper should use the same font family, similar font sizes, and consistent color schemes. Inconsistency signals that the paper was assembled hastily. Reviewers notice. Standardize your visual formatting before you submit.
Overloading a Single Figure
Trying to show too much in one figure reduces clarity. If you have six variables to plot, consider whether two separate figures would communicate more effectively than one cluttered graph. Simplicity is not a weakness. It is a design decision that respects your reader.
How Figures and Tables Affect Peer Review Outcomes
Understanding how to use figures and tables effectively in a research paper is not just about aesthetics. It directly affects whether your submission passes peer review. Reviewers assess whether your data presentation supports your claims, whether your visuals are reproducible, and whether your formatting meets journal standards.
Submissions with poorly formatted visuals often receive revision requests before the scientific content is even evaluated in depth. That adds time to your publication timeline and creates additional work. Getting visuals right the first time is a competitive advantage.
If your paper has been rejected and you are analyzing what went wrong, visual presentation is worth examining closely. Our resource on what makes a research paper get rejected covers the full range of common rejection reasons, including data presentation issues.
For students supporting a young researcher through a difficult review process, our guide on how to support your child through research paper rejection offers practical perspective on turning setbacks into stronger submissions.
A Practical Checklist Before You Submit
Run through this checklist before finalizing any research paper with figures or tables.
Every figure and table is referenced by number in the body text.
Figures and tables are numbered in separate sequential series.
Every figure has a standalone caption placed below it.
Every table has a standalone title placed above it.
All axes are labeled with variable names and units.
All column and row headers are clear and unambiguous.
No data is presented redundantly in both a figure and a table.
All abbreviations in visuals are defined in captions or notes.
Formatting (fonts, colors, line styles) is consistent across all visuals.
Each visual is interpreted explicitly in the surrounding text.
How to Use Figures and Tables Effectively in a Research Paper: Final Thoughts
Your data is only as persuasive as its presentation. Mastering how to use figures and tables effectively in a research paper is a skill that compounds over time. Every paper you write is an opportunity to refine it.
The researchers whose work endures are not just those with the most interesting questions. They are the ones who communicate their findings with precision and clarity. Figures and tables are where that precision becomes visible.
At PJPCR, we publish original research by high school students across more than 50 academic disciplines. Every submission goes through rigorous double-blind peer review (no shortcuts, no rubber stamps). If you are ready to take your research to publication, explore our submission process and see how your work can reach an international academic audience. You can also browse our research and writing guides to strengthen every section of your paper before you submit.
Your research deserves to be read. Present it accordingly.
Read More

Can high school students be peer reviewers
By
Princeton Journal of Pre-Collegiate Research
Read more

What reviewing other papers teaches you about your own
By
Princeton Journal of Pre-Collegiate Research
Read more

How to give useful feedback on a classmate's paper
By
Princeton Journal of Pre-Collegiate Research
Read more

Student editorial boards: how they work
By
Princeton Journal of Pre-Collegiate Research
Read more
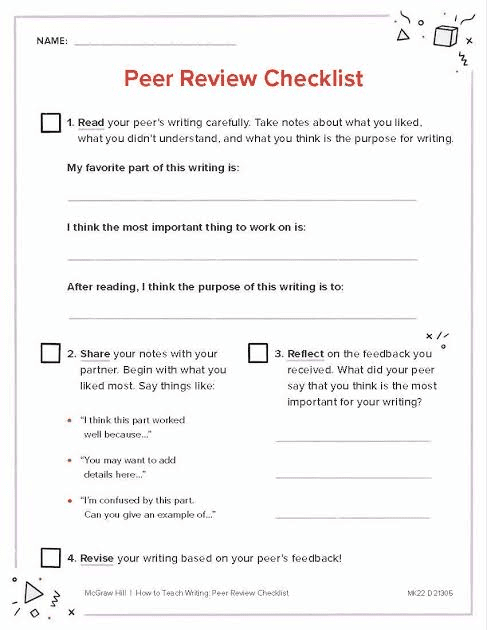
How to write a peer review as a student
By
Princeton Journal of Pre-Collegiate Research
Read more

Peer review etiquette: tone, structure, fairness
By
Princeton Journal of Pre-Collegiate Research
Read more

Version control for research documents
By
Princeton Journal of Pre-Collegiate Research
Read more

Digital vs paper lab notebooks for students
By
Princeton Journal of Pre-Collegiate Research
Read more

Data management basics for student researchers
By
Princeton Journal of Pre-Collegiate Research
Read more
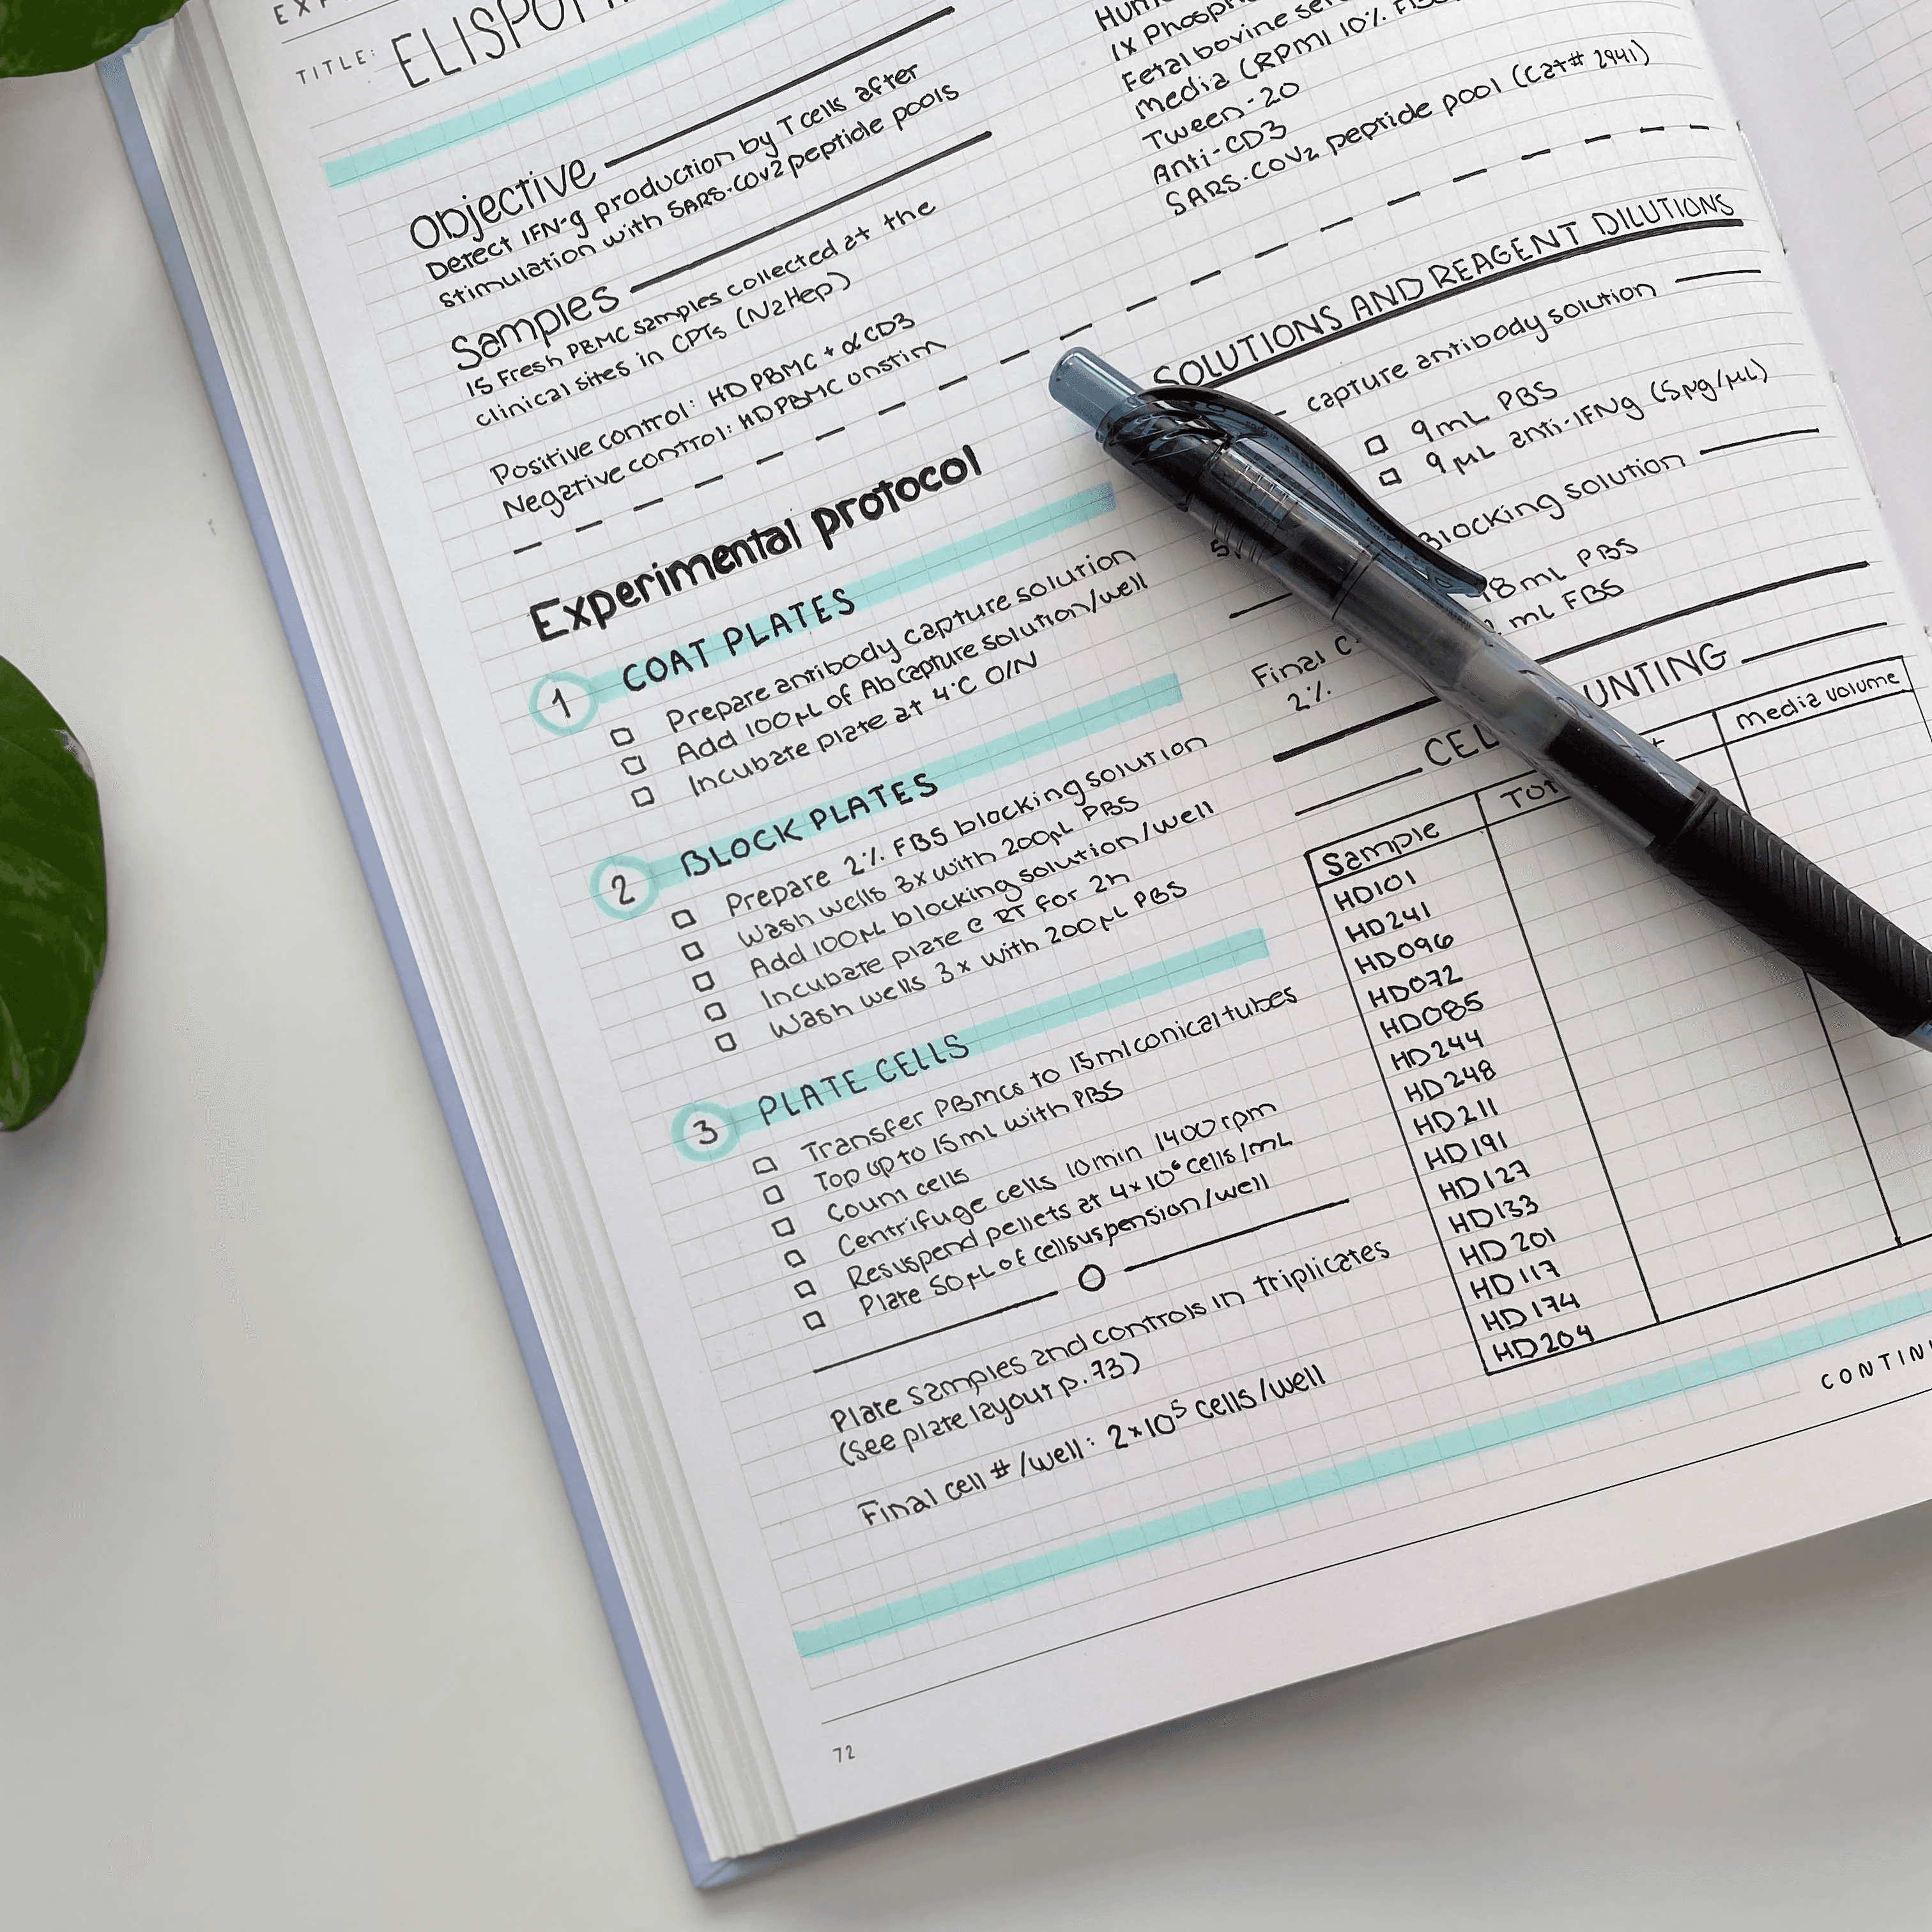
How to keep a lab notebook that reviewers trust
By
Princeton Journal of Pre-Collegiate Research
Read more

How to organize research files across a year-long project
By
Princeton Journal of Pre-Collegiate Research
Read more

How to document your data so you can defend it
By
Princeton Journal of Pre-Collegiate Research
Read more

How to write a grant proposal as a student
By
Princeton Journal of Pre-Collegiate Research
Read more

Free resources that replace research funding
By
Princeton Journal of Pre-Collegiate Research
Read more
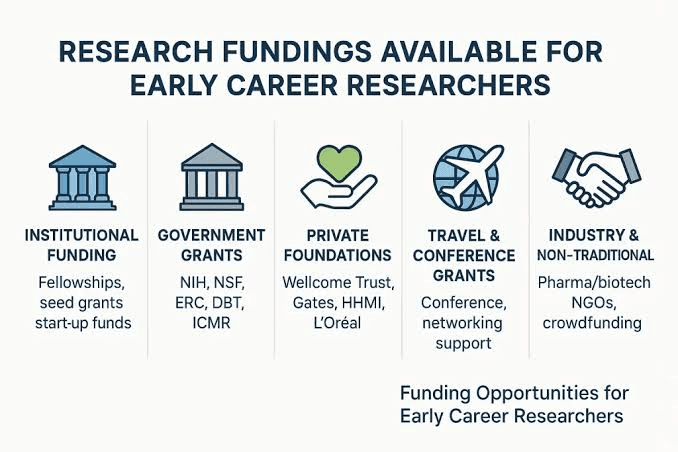
Corporate and nonprofit programs that fund student research
By
Princeton Journal of Pre-Collegiate Research
Read more

Science fair grants and material stipends explained
By
Princeton Journal of Pre-Collegiate Research
Read more

Crowdfunding a student research project: does it work
By
Princeton Journal of Pre-Collegiate Research
Read more

How much does a research project actually cost
By
Princeton Journal of Pre-Collegiate Research
Read more

How to ask your school to fund your project
By
Princeton Journal of Pre-Collegiate Research
Read more

Grants for high school research projects: what exists
By
Princeton Journal of Pre-Collegiate Research
Read more

How to start a research club at your school
By
Princeton Journal of Pre-Collegiate Research
Read more