How to make publication-quality graphs for free
Princeton Journal of Pre-Collegiate Research
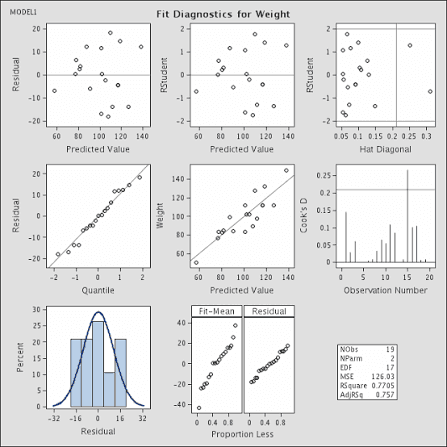
How to make publication-quality graphs for free
This post answers one specific question: how can a high school student produce graphs that meet academic journal standards without paying for software? It is written for students in grades 9 through 12 who have collected data and need to present it clearly and credibly. After reading this guide, you will know which free tools to use, what standards reviewers apply to figures, and how to avoid the formatting errors that most commonly cause rejection. When your research is ready for peer review, the Princeton Journal of Pre-Collegiate Research accepts original student work across all academic disciplines.
Why graph quality matters more than most students expect
Peer reviewers assess figures independently of the written text. A graph that cannot stand alone, meaning one that requires the caption or body text to be interpretable, is a signal that the data presentation needs revision. According to the American Psychological Association's Publication Manual (7th edition), every figure must be understandable without reference to the surrounding text. Most submission guides mention this requirement briefly. Most students discover it only after receiving a revision request.
The challenge for high school researchers is practical: professional data visualisation software is expensive, and school licences rarely cover the tools that journals expect. The good news is that several free tools produce figures that fully meet publication standards. The difference between a rejected figure and an accepted one is almost never the software. It is the decisions made about axis labels, font sizes, colour contrast, and data-to-ink ratio.
How do you make publication-quality graphs for free as a high school student?
Publication-quality graphs can be produced at no cost using tools including R with ggplot2, Python with Matplotlib or Seaborn, and the web-based platform Datawrapper. Each produces figures that meet standard journal requirements for resolution (300 DPI minimum), font legibility, and export format. The choice of tool depends on the student's data type and technical background, not on budget.
The following steps apply regardless of which tool you use.
Export at 300 DPI or higher. Most journals require figures submitted as TIFF, EPS, or high-resolution PNG files. Exporting a graph as a screenshot or a low-resolution JPEG will result in desk rejection or a mandatory revision. In R, use
ggsave()with thedpi = 300argument. In Python, useplt.savefig('figure.png', dpi=300). Datawrapper exports at print resolution by default.Label every axis with the variable name and unit. An axis labelled only "Score" tells the reviewer nothing. An axis labelled "Reading Comprehension Score (0-100)" tells the reviewer everything. Include units in parentheses. This is a requirement in every major style guide, including APA and ACS.
Use a font size of at least 10pt for all text within the figure. Axis labels, tick marks, legends, and titles must remain legible after the figure is scaled to column width in a journal layout. A font that reads clearly on a laptop screen at full size often becomes illegible at print scale.
Remove chartjunk. Edward Tufte's principle of maximising the data-to-ink ratio remains the standard in academic publishing. Remove gridlines that do not aid interpretation, three-dimensional effects, background shading, and decorative borders. Every element that does not convey data should be deleted.
Choose colours that are accessible to colour-blind readers. Approximately 8 percent of males have some form of colour vision deficiency, according to the National Eye Institute. The Okabe-Ito palette and the viridis palette in R are both colour-blind safe and are widely used in published research. Datawrapper flags colour contrast issues automatically.
Write a complete figure caption. The caption is part of the figure. It must state what is shown, what the axes represent, what error bars indicate (if present), and the sample size. A caption that reads only "Figure 1: Results" will not pass peer review.
For a broader overview of free tools available to student researchers, the guide to best free tools for high school researchers covers additional software across data collection, analysis, and writing.
What separates a publishable figure from a well-made class graph?
The distinction is not aesthetic. A class graph communicates a result to a teacher who already knows the context. A publishable figure must communicate a result to a reviewer who knows nothing about the study except what is written in the paper.
This difference has concrete consequences. A class graph might omit error bars because the teacher knows the data came from a single trial. A publishable figure must show variability, whether as standard deviation, standard error, or confidence intervals, because the reviewer cannot otherwise assess whether the result is meaningful. A class graph might use a default Excel colour scheme because the teacher views it on screen. A publishable figure must use colours that remain distinguishable in greyscale, because many journals still print in black and white.
The other major difference is in the choice of graph type. Bar charts are overused in student research. For continuous data comparing two groups, a box plot or violin plot conveys far more information: the median, the interquartile range, the full distribution, and any outliers. Journals in biology, psychology, and the social sciences increasingly require authors to show the underlying data distribution rather than summarising it into a mean and error bar. Switching from a bar chart to a box plot in R requires changing one function call. The impact on a reviewer's assessment of the work is substantial.
Students preparing figures for journal submission can also review what makes a research paper get rejected for a broader account of the figure and methodology issues that most commonly lead to rejection.
What mistakes do students most commonly make when preparing research figures?
The four mistakes below account for the majority of figure-related revision requests at peer-reviewed journals. Each one is avoidable with a single corrective action.
Submitting figures embedded in a Word document. Figures embedded in a Word file are compressed automatically when the document is saved. The resulting resolution is typically 96 DPI, well below the 300 DPI minimum required for print publication. Students embed figures in Word because it is convenient during the writing process. The fix is to save all figures as separate high-resolution files and upload them individually during submission. Most journal submission systems have a dedicated field for figure files.
Using default software colour schemes. The default blue-orange palette in Microsoft Excel and the default colour cycle in Matplotlib were not designed for academic publishing. They are not colour-blind safe and they do not reproduce well in greyscale. Students use them because they are the first option available. The fix is to specify a named accessible palette explicitly. In Python, seaborn.set_palette('colorblind') applies a colour-blind safe scheme in one line.
Omitting error bars or confidence intervals. A mean without a measure of variability is not a complete result. Reviewers in quantitative fields will request error bars as a matter of course. Students omit them because calculating standard error feels like an additional step after the main analysis is done. The fix is to treat variability as part of the result, not as a formatting detail. Free statistics tools make this straightforward; the guide to best free statistics software for student research covers the options in detail.
Inconsistent formatting across figures. When Figure 1 uses a 12pt sans-serif font and Figure 3 uses a 9pt serif font, the paper reads as unfinished. Journals expect all figures to use a consistent typeface, font size, and colour scheme. The fix is to define a style template at the start of the analysis and apply it to every figure before submission.
How to produce publication-quality graphs for free, step by step
Choose your tool based on your data type. Use R with ggplot2 for statistical graphics, especially box plots, scatter plots with regression lines, and multi-panel figures. Use Python with Matplotlib or Seaborn for custom visualisations and figures that require programmatic control. Use Datawrapper for clean, accessible charts when you do not need statistical overlays.
Prepare your data before opening any visualisation tool. Figures built on messy data produce misleading visuals. Clean your dataset first: remove duplicates, confirm units are consistent, and verify that outliers are genuine data points rather than entry errors.
Select the correct graph type for your data. Use scatter plots for continuous bivariate data. Use box plots or violin plots for comparing distributions across groups. Use line graphs for time-series data. Use bar charts only for categorical count data where no distribution information exists.
Apply an accessible colour palette. In R, install the
ggthemespackage and usescale_colour_colorblind(). In Python, setseaborn.set_palette('colorblind')at the start of your script. In Datawrapper, select a palette from the accessible options in the colour settings panel.Label all axes, add a complete caption, and verify font sizes are at least 10pt. Do this before exporting. Editing text size after export is not possible in raster formats.
Export at 300 DPI as a PNG or TIFF file. Save the file with a descriptive name that matches the figure number in your manuscript, for example
figure2_boxplot_scores.png.Review the figure in greyscale. Open the exported file, convert it to greyscale in any image viewer, and confirm that all data series remain distinguishable. If they do not, adjust the palette or add pattern fills before resubmitting.
PJPCR publishes original research across all academic disciplines. If your figures and manuscript are ready for peer review, review the submission guidelines at princeton-jpcr.org/submit.
Frequently asked questions about making publication-quality graphs for free
What is a publication-quality graph?
A publication-quality graph is a figure that meets the technical and stylistic standards required by academic journals for print and digital publication. This means a minimum resolution of 300 DPI, legible axis labels with units, an accessible colour scheme, no decorative elements that obscure data, and a complete standalone caption. These standards apply regardless of the discipline or journal.
How long does it take to learn R or Python well enough to make publication figures?
Most students can produce a basic publication-quality scatter plot or box plot in R using ggplot2 within two to four hours of starting from scratch, using free tutorials available through the R Graph Gallery or the official ggplot2 documentation. Python with Seaborn has a comparable learning curve. Neither requires prior programming experience to produce standard academic figures.
Do I need statistical software to make publication-quality graphs, or can I use Excel?
Excel can produce publication-quality figures, but it requires significant manual adjustment to meet journal standards. Default Excel charts use low-contrast colours, include unnecessary gridlines, and export at screen resolution unless settings are changed explicitly. R, Python, and Datawrapper produce journal-ready output with less manual correction. For students who prefer Excel, the key steps are: remove all default formatting, export as a PDF or high-resolution PNG, and verify the output at 300 DPI.
What makes a figure strong enough to pass peer review?
A figure passes peer review when it communicates one clear result without requiring the reader to consult the body text. Specifically, reviewers assess whether the axes are fully labelled with units, whether variability is shown for quantitative comparisons, whether the graph type is appropriate for the data, and whether the caption is complete. Aesthetic quality matters less than interpretive clarity.
What kinds of research does PJPCR publish, and what are the figure requirements?
The Princeton Journal of Pre-Collegiate Research publishes original, peer-reviewed research by high school students across the sciences, social sciences, humanities, and interdisciplinary fields. Figure requirements follow standard academic publishing conventions: 300 DPI minimum, separate high-resolution files, and complete captions. Full technical requirements are available on the peer review process page and in the submission guidelines. The standard review timeline is 2 to 3 months. A fast-track option is available for students who need a quicker turnaround.
What to do next
Publication-quality graphs require three things: the right tool, the right export settings, and a clear understanding of what peer reviewers assess when they evaluate a figure. Free tools including R with ggplot2, Python with Seaborn, and Datawrapper each meet journal standards when used correctly. The most common errors, including low-resolution exports, inaccessible colour schemes, and missing error bars, are all correctable before submission. Addressing them before submitting is faster than addressing them in a revision request.
Students who want to see how published figures are presented in peer-reviewed student research can browse published issues at princeton-jpcr.org/issues. When your research and figures are ready for peer review, submit your work to PJPCR at princeton-jpcr.org/submit.
Read More

How to write a grant proposal as a student
By
Princeton Journal of Pre-Collegiate Research
Read more

Free resources that replace research funding
By
Princeton Journal of Pre-Collegiate Research
Read more
Corporate and nonprofit programs that fund student research
By
Princeton Journal of Pre-Collegiate Research
Read more

Science fair grants and material stipends explained
By
Princeton Journal of Pre-Collegiate Research
Read more

Crowdfunding a student research project: does it work
By
Princeton Journal of Pre-Collegiate Research
Read more

How much does a research project actually cost
By
Princeton Journal of Pre-Collegiate Research
Read more

How to ask your school to fund your project
By
Princeton Journal of Pre-Collegiate Research
Read more

Grants for high school research projects: what exists
By
Princeton Journal of Pre-Collegiate Research
Read more

How to start a research club at your school
By
Princeton Journal of Pre-Collegiate Research
Read more

How to organize a school research symposium
By
Princeton Journal of Pre-Collegiate Research
Read more

Turning a school club into a research pipeline
By
Princeton Journal of Pre-Collegiate Research
Read more

How to start a student research journal at your school
By
Princeton Journal of Pre-Collegiate Research
Read more

How to find a faculty sponsor for a research club
By
Princeton Journal of Pre-Collegiate Research
Read more

How to propose an independent study for research credit
By
Princeton Journal of Pre-Collegiate Research
Read more

Running a peer-review workshop at your school
By
Princeton Journal of Pre-Collegiate Research
Read more

How to get school funding for student research
By
Princeton Journal of Pre-Collegiate Research
Read more

How to do research as a team of students
By
Princeton Journal of Pre-Collegiate Research
Read more

Dividing work fairly in a group research project
By
Princeton Journal of Pre-Collegiate Research
Read more

Group research vs solo research: pros and cons
By
Princeton Journal of Pre-Collegiate Research
Read more

Resolving disagreements in group research
By
Princeton Journal of Pre-Collegiate Research
Read more
What to do when a co-author stops contributing
By
Princeton Journal of Pre-Collegiate Research
Read more